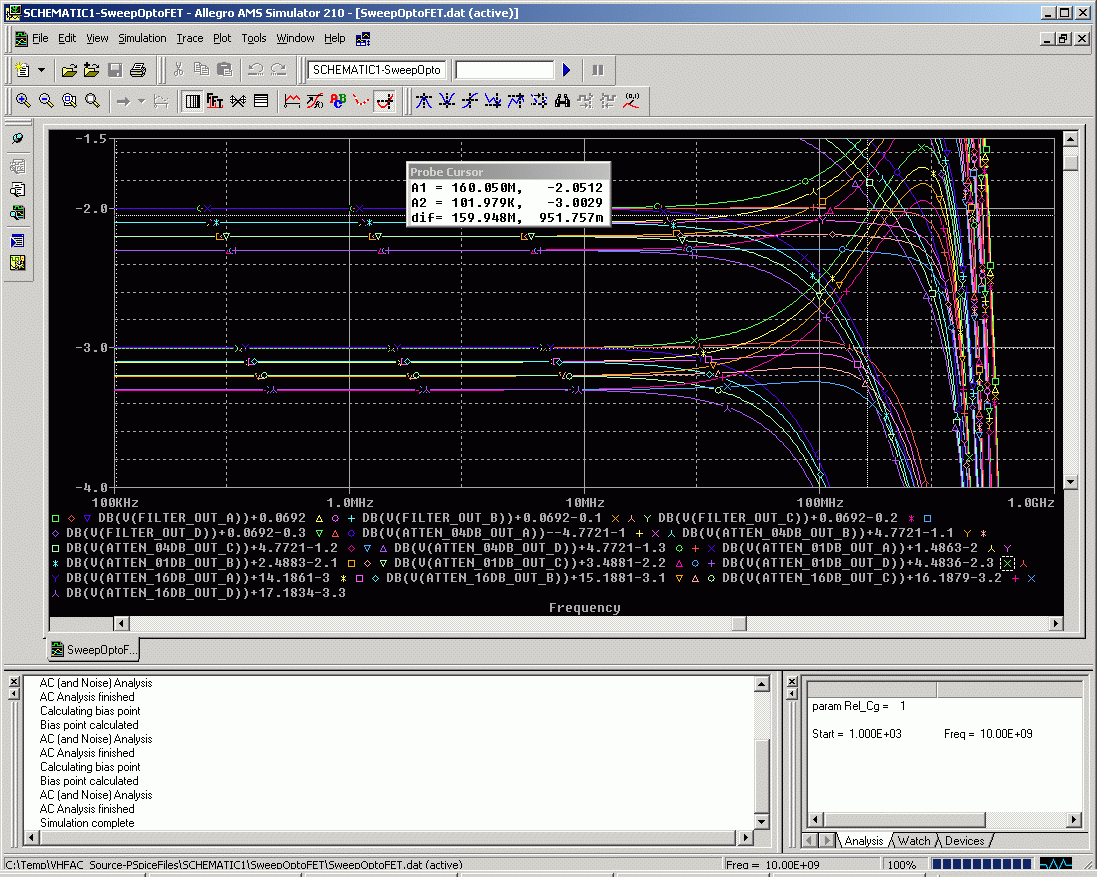
This graph shows the normalized frequency response for a number of attenuators.
Each one is shown for nominal, fast, and slow parameters for resistance and capacitance of the Opto FETs.
The design was optimized so that the frequency response would track for any particular lot of OptoFETs.
